
Phase 1, Aim 1
CFD Analysis, Computer Simulation and Modeling
Our CFD Data consists of CAD files meant for CFD simulations. Due to the nature of CFD solution files, it is impractical for us to upload hundreds of gigabytes of solution data, so we opted to share the models used for our simulation and image results.
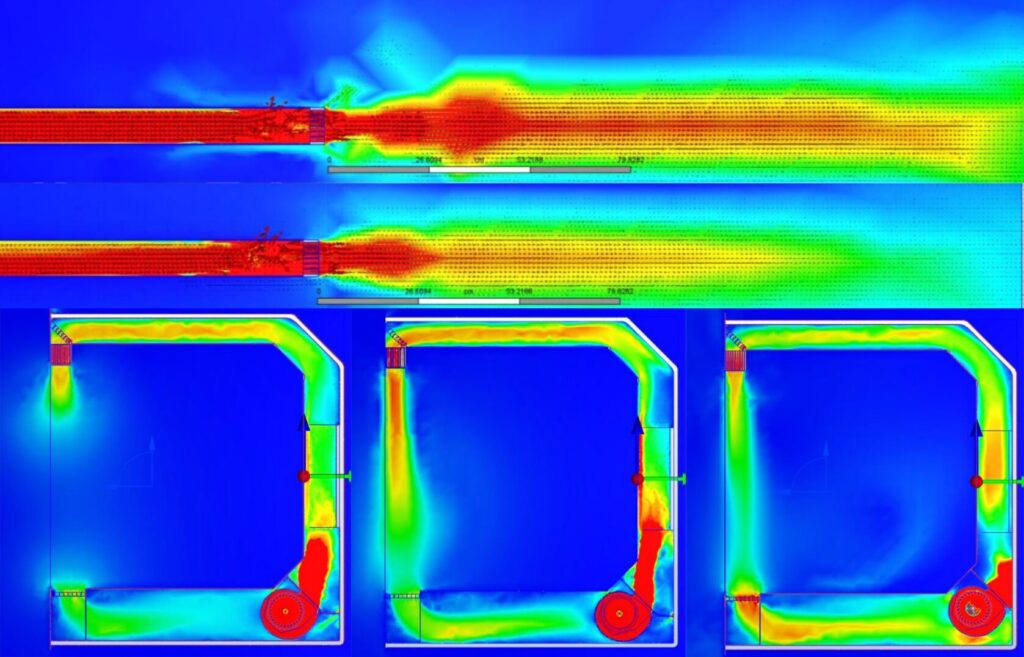
We used Autodesk CFD for our software, but results should be agnostic across different solvers. Sometimes individual simulations require minute changes to the mesh and simulation parameters, making sharing the exact setup for each simulation extremely burdensome.
We would be happy to provide instructions on how to run specific simulations per file or share the raw solution files upon request.
https://tissuecontrol.com/wp-content/uploads/2025/05/CFD.zip
Robot Measurement System (AR4)
This is the data generated by a 7-axis robot arm (Annin AR4) measuring Z-axis flow. The first 12 columns are air speed, 13th is an average and 14-16th are the XYZ coordinates of the robot. The last column is time.
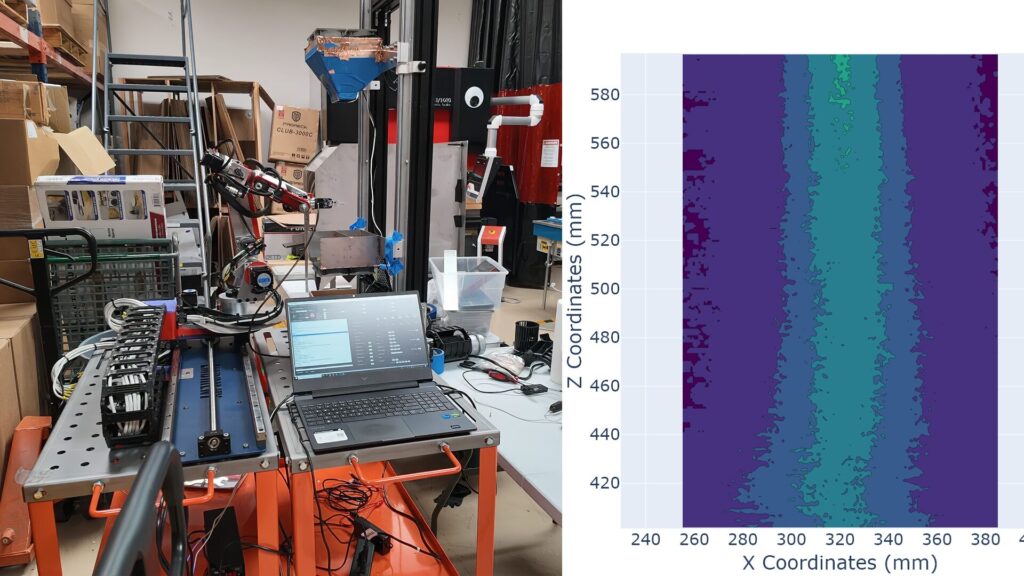
We used a hot wire anemometer (the Wind Sensor Rev P. from Modern Devices) for Air velocity measurements (https://www.researchgate.net/figure/Rev-P-hot-element-anemometer-from-Modern-Device_fig1_311537191) and used the it to determine velocity and derive kinetic energy calculated from the vortex shed angle.
This data was processed to construct 2-D slices with images using a python script. Some of the slices may not show an useful profile due to the slices being auto generated using average coordinates. More precise slices can be generated upon request or as an exercise to the reader.
https://tissuecontrol.com/wp-content/uploads/2025/05/RobotArm.zip
Lee’s Disc Thermal Conductivity Testing
Although not strictly related to our Phase I objectives, we conducted a Lee’s Disc experiment using a variety of high insulation materials to determine their actual vs advertised thermal conductivity. We wanted to evaluate the feasibility and effectiveness of using Aerogel based insulation over conventional ceramic fiber.
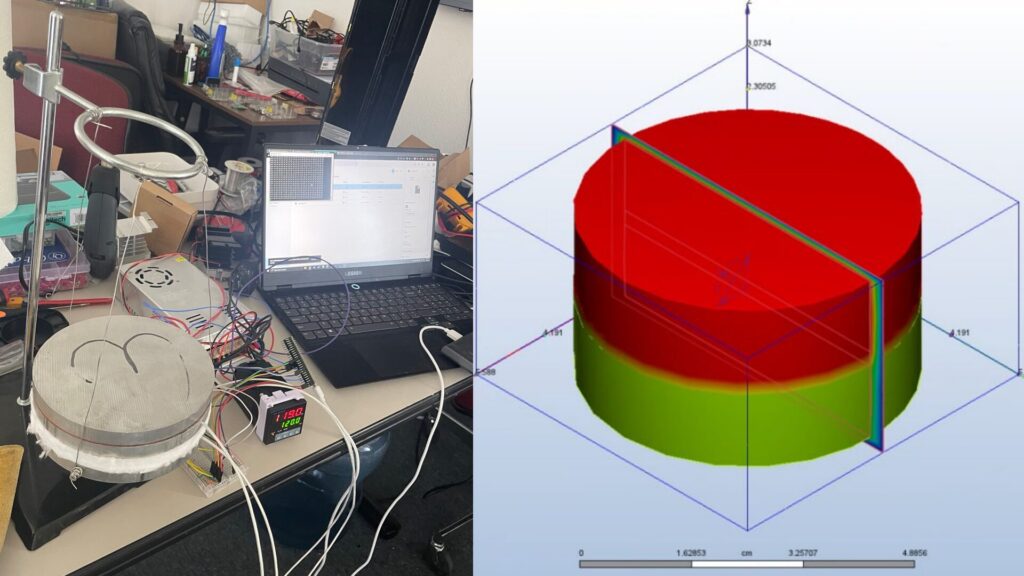
The LeeDisc.zip file contains a summary of results and calculations, while each individual file is a sample. Column 1 of sample depicts time while Column 2 depicts temperature.
https://tissuecontrol.com/wp-content/uploads/2025/05/LeesDisc.zip
Phase 2 Aim 1
Robot Measuring System (CRS F3 + CRS Catalyst 5)
This is the data generated by a 6-axis robot measuring Z-axis flow. The first 6 columns contain position data and the remaining 12 are the air speed in m/s.
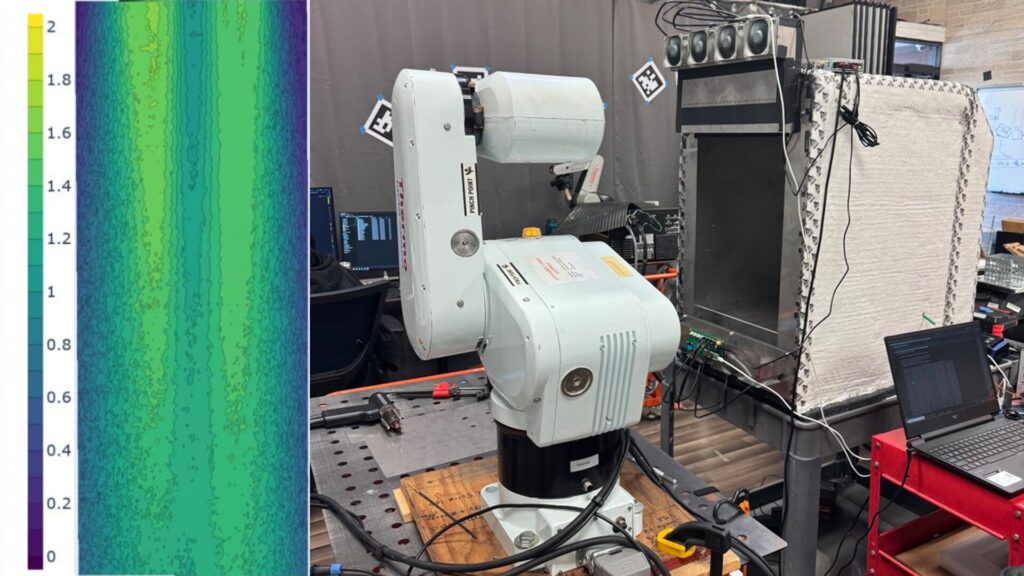
Based on the success in Phase 1, we again used a hot wire anemometer (the Wind Sensor Rev P. from Modern Devices) for Air velocity and kinetic energy measurements.
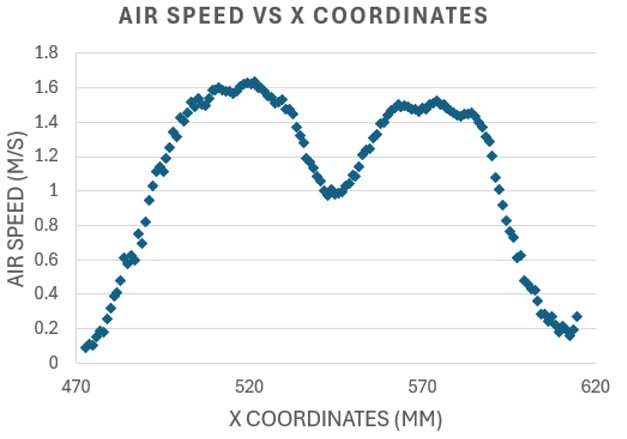
This data was processed to construct 2-D slices with images using a python script. Some of the slices may not show an useful profile due to the slices being auto generated using average coordinates. More precise slices can be generated upon request or as an exercise to the reader.
https://tissuecontrol.com/wp-content/uploads/2025/05/CRSRobotArm.zip
Loss efficiency Data
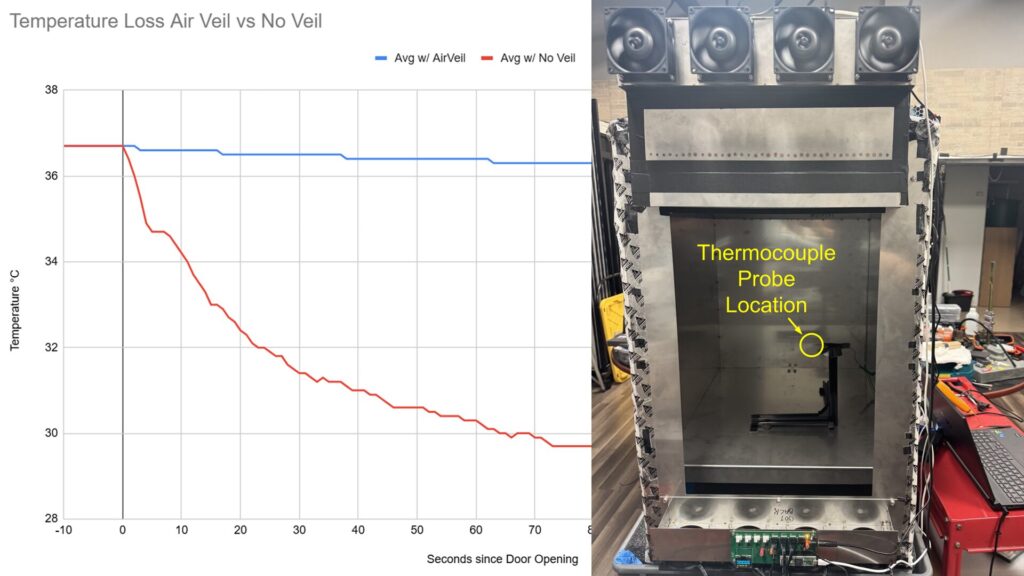
The stacked air veil design allowed us to demonstrate significant improvements in loss efficiency over conventional incubator designs.
The graph shows the temperature inside the chamber after the temperature was raised to set point, and the door opened with temperature compensation turned off. Blue is with an Air Veil and Red is without. It clearly shows difference in loss between the two designs.
Temperature was logged using a Fluke F3000 FC with NIST calibration.
https://tissuecontrol.com/wp-content/uploads/2025/05/TemperatureCSV.zip